Plotting JSON Data with Chart.js
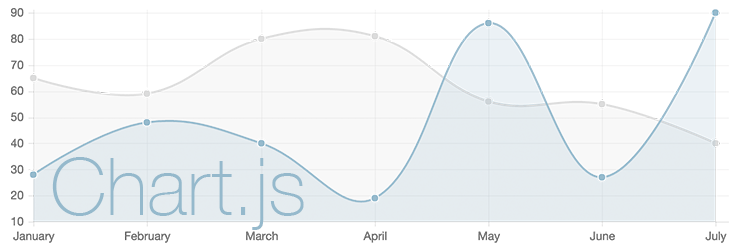
Chart.js is a open-source, light-weight (~11KB) library based on the HTML5 canvas control. It supports a limited number of charts, but unlike Google Charts it can be embedded directly in your website and made available offline.
Table of Contents
Basic Usage
To use Chart.js, you will need to include the Chart.js source, add a Canvas control to your page, and instantiate a new chart passing in a reference to your dataset:
<script src="/assets/js/Chart.min.js"></script>
<script src="/assets/js/jquery-1.12.0.min.js"></script> <!--Optional-->

<canvas id="myChart" width="740" height="200"></canvas>

<script>
  // Get the context of the canvas element we want to select
  var ctx = document.getElementById("myChart").getContext("2d");

  // Instantiate a new chart using 'data' (defined below)
  var myChart = new Chart(ctx).Line(data);
</script>
Note: For details on defining the default configuration settings for all of your charts see the Global Settings section later in this guide.
Static JSON Data
You can include a static dataset directly on your page by defining your data
variable in the script section of your page:
var data = {
    labels: ["January", "February", "March", "April", "May", "June", "July"],
    datasets: [
      {
        label: "My First dataset",
        fillColor: "rgba(220,220,220,0.2)",
        strokeColor: "rgba(220,220,220,1)",
        pointColor: "rgba(220,220,220,1)",
        pointStrokeColor: "#fff",
        pointHighlightFill: "#fff",
        pointHighlightStroke: "rgba(220,220,220,1)",
        data: [65, 59, 80, 81, 56, 55, 40]
      },
      {
        label: "My Second dataset",
        fillColor: "rgba(151,187,205,0.2)",
        strokeColor: "rgba(151,187,205,1)",
        pointColor: "rgba(151,187,205,1)",
        pointStrokeColor: "#fff",
        pointHighlightFill: "#fff",
        pointHighlightStroke: "rgba(151,187,205,1)",
        data: [28, 48, 40, 19, 86, 27, 90]
      }
    ]
  };
This will give you the following chart:
Loading JSON Data with JQuery
jQuery can also be used to load JSON data from a URL, but in most cases the raw JSON data will also need to be converted to a format that chart.js understands.
The code below will use jQuery to load JSON data from a URL and separate it
into two arrays (labels, data), and then insert that data into an object
chart.js understands (tempData):
function drawLineChart() {

  // Add a helper to format timestamp data
  Date.prototype.formatMMDDYYYY = function() {
      return (this.getMonth() + 1) +
      "/" +  this.getDate() +
      "/" +  this.getFullYear();
  }

  var jsonData = $.ajax({
    url: 'http://d.microbuilder.io:8080/test/temp',
    dataType: 'json',
  }).done(function (results) {

    // Split timestamp and data into separate arrays
    var labels = [], data=[];
    results["packets"].forEach(function(packet) {
      labels.push(new Date(packet.timestamp).formatMMDDYYYY());
      data.push(parseFloat(packet.payloadString));
    });

    // Create the chart.js data structure using 'labels' and 'data'
    var tempData = {
      labels : labels,
      datasets : [{
          fillColor             : "rgba(151,187,205,0.2)",
          strokeColor           : "rgba(151,187,205,1)",
          pointColor            : "rgba(151,187,205,1)",
          pointStrokeColor      : "#fff",
          pointHighlightFill    : "#fff",
          pointHighlightStroke  : "rgba(151,187,205,1)",
          data                  : data
      }]
    };

    // Get the context of the canvas element we want to select
    var ctx = document.getElementById("myLineChart").getContext("2d");

    // Instantiate a new chart
    var myLineChart = new Chart(ctx).Line(tempData);
  });
}

drawLineChart();
Line Charts
Example
A sample chart can be seen below based on temperature data
logged from MQTT publications to the /test/temp topic. Data was published to
this topic via the following command (using node and
the mqtt package installed via sudo npm install -g mqtt):
$ mqtt pub -h d.microbuilder.io -t test/temp -m '17.8'Note: The MQTT broker at d.microbuilder.io is shown as an example and is not publicly accessible, although the JSON records are publicly available.
Source Code
The Javascript code required to read JSON data from a specific URL is shown
below. Please note that this code will attempt to convert the .payloadString
field in the JSON record to a float value, so any string based payloads will
fail to parse.
<script src="/assets/js/jquery-1.12.0.min.js"></script>
<script src="/assets/js/Chart.min.js"></script>

<canvas id="myLineChart" width="740" height="200"></canvas>

<script>
  function drawLineChart() {

    // Add a helper to format timestamp data
    Date.prototype.formatMMDDYYYY = function() {
        return (this.getMonth() + 1) +
        "/" +  this.getDate() +
        "/" +  this.getFullYear();
    }

    var jsonData = $.ajax({
      url: 'http://d.microbuilder.io:8080/test/temp',
      dataType: 'json',
    }).done(function (results) {

      // Split timestamp and data into separate arrays
      var labels = [], data=[];
      results["packets"].forEach(function(packet) {
        labels.push(new Date(packet.timestamp).formatMMDDYYYY());
        data.push(parseFloat(packet.payloadString));
      });

      // Create the chart.js data structure using 'labels' and 'data'
      var tempData = {
        labels : labels,
        datasets : [{
            fillColor             : "rgba(151,187,205,0.2)",
            strokeColor           : "rgba(151,187,205,1)",
            pointColor            : "rgba(151,187,205,1)",
            pointStrokeColor      : "#fff",
            pointHighlightFill    : "#fff",
            pointHighlightStroke  : "rgba(151,187,205,1)",
            data                  : data
        }]
      };

      // Get the context of the canvas element we want to select
      var ctx = document.getElementById("myLineChart").getContext("2d");

      // Instantiate a new chart
      var myLineChart = new Chart(ctx).Line(tempData, {
        //bezierCurve: false
      });
    });
  }

  drawLineChart();
</script>
Global Settings
Chart.js uses a set of global settings that determine how every chart will be rendered. If you wish to change any of settings from the library defaults you should include the global settings section below in your script:
// Set the global Chart values (these will apply to all charts)
Chart.defaults.global = {
  // Boolean - Whether to animate the chart
  animation: true,

  // Number - Number of animation steps
  animationSteps: 60,

  // String - Animation easing effect
  // Possible effects are:
  // [easeInOutQuart, linear, easeOutBounce, easeInBack, easeInOutQuad,
  //  easeOutQuart, easeOutQuad, easeInOutBounce, easeOutSine, easeInOutCubic,
  //  easeInExpo, easeInOutBack, easeInCirc, easeInOutElastic, easeOutBack,
  //  easeInQuad, easeInOutExpo, easeInQuart, easeOutQuint, easeInOutCirc,
  //  easeInSine, easeOutExpo, easeOutCirc, easeOutCubic, easeInQuint,
  //  easeInElastic, easeInOutSine, easeInOutQuint, easeInBounce,
  //  easeOutElastic, easeInCubic]
  animationEasing: "easeOutQuart",

  // Boolean - If we should show the scale at all
  showScale: true,

  // Boolean - If we want to override with a hard coded scale
  scaleOverride: false,

  // ** Required if scaleOverride is true **
  // Number - The number of steps in a hard coded scale
  scaleSteps: null,
  // Number - The value jump in the hard coded scale
  scaleStepWidth: null,
  // Number - The scale starting value
  scaleStartValue: null,

  // String - Colour of the scale line
  scaleLineColor: "rgba(0,0,0,.1)",

  // Number - Pixel width of the scale line
  scaleLineWidth: 1,

  // Boolean - Whether to show labels on the scale
  scaleShowLabels: true,

  // Interpolated JS string - can access value
  scaleLabel: "<%=value%>",

  // Boolean - Whether the scale should stick to integers, not floats even if drawing space is there
  scaleIntegersOnly: true,

  // Boolean - Whether the scale should start at zero, or an order of magnitude down from the lowest value
  scaleBeginAtZero: false,

  // String - Scale label font declaration for the scale label
  scaleFontFamily: "'Helvetica Neue', 'Helvetica', 'Arial', sans-serif",

  // Number - Scale label font size in pixels
  scaleFontSize: 12,

  // String - Scale label font weight style
  scaleFontStyle: "normal",

  // String - Scale label font colour
  scaleFontColor: "#666",

  // Boolean - whether or not the chart should be responsive and resize when the browser does.
  responsive: false,

  // Boolean - whether to maintain the starting aspect ratio or not when responsive, if set to false, will take up entire container
  maintainAspectRatio: true,

  // Boolean - Determines whether to draw tooltips on the canvas or not
  showTooltips: true,

  // Function - Determines whether to execute the customTooltips function instead of drawing the built in tooltips (See [Advanced - External Tooltips](#advanced-usage-external-tooltips))
  customTooltips: false,

  // Array - Array of string names to attach tooltip events
  tooltipEvents: ["mousemove", "touchstart", "touchmove"],

  // String - Tooltip background colour
  tooltipFillColor: "rgba(0,0,0,0.8)",

  // String - Tooltip label font declaration for the scale label
  tooltipFontFamily: "'Helvetica Neue', 'Helvetica', 'Arial', sans-serif",

  // Number - Tooltip label font size in pixels
  tooltipFontSize: 14,

  // String - Tooltip font weight style
  tooltipFontStyle: "normal",

  // String - Tooltip label font colour
  tooltipFontColor: "#fff",

  // String - Tooltip title font declaration for the scale label
  tooltipTitleFontFamily: "'Helvetica Neue', 'Helvetica', 'Arial', sans-serif",

  // Number - Tooltip title font size in pixels
  tooltipTitleFontSize: 14,

  // String - Tooltip title font weight style
  tooltipTitleFontStyle: "bold",

  // String - Tooltip title font colour
  tooltipTitleFontColor: "#fff",

  // String - Tooltip title template
  tooltipTitleTemplate: "<%= label%>",

  // Number - pixel width of padding around tooltip text
  tooltipYPadding: 6,

  // Number - pixel width of padding around tooltip text
  tooltipXPadding: 6,

  // Number - Size of the caret on the tooltip
  tooltipCaretSize: 8,

  // Number - Pixel radius of the tooltip border
  tooltipCornerRadius: 6,

  // Number - Pixel offset from point x to tooltip edge
  tooltipXOffset: 10,

  // String - Template string for single tooltips
  tooltipTemplate: "<%if (label){%><%=label%>: <%}%><%= value %>",

  // String - Template string for multiple tooltips
  multiTooltipTemplate: "<%= value %>",

  // Function - Will fire on animation progression.
  onAnimationProgress: function(){},

  // Function - Will fire on animation completion.
  onAnimationComplete: function(){}
}
You can override these default values in individual charts during instantiation:
new Chart(ctx).Line(data, {
  bezierCurve: false
});